
Linear Dynamics
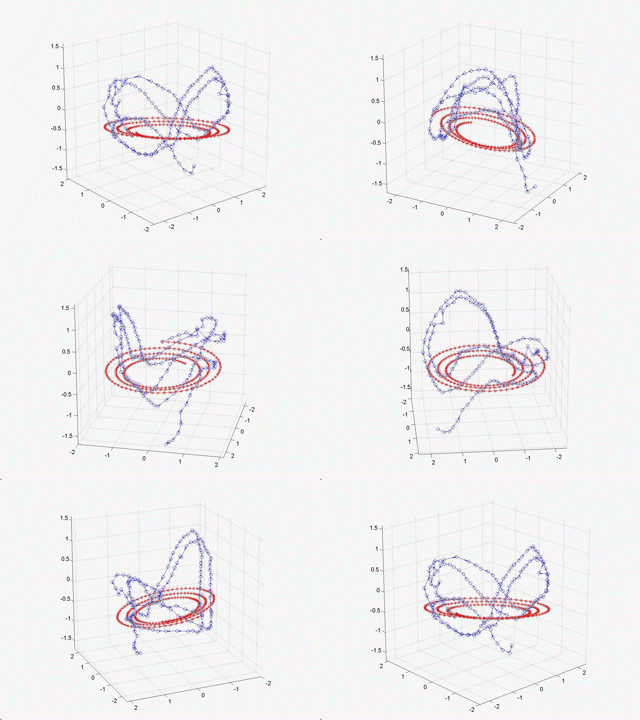
With a linear kernel for dynamics, the GPDM mean-prediction simulations do
not capture all the complexities of the motion (Fig 3c). Notice the sliding of the feet
in the resulting animation. As the red simulation curve
drifts toward the origin, which correspond to the mean pose, no limit cycle
through the training data is
recovered.
Mean-Prediction vs Optimization
A GPDM of walk data sampled at 120 frames per gait cycle learned with 1st
order linear + RBF kernel dynamics (Fig 2d). The mean-prediction
simulation (red) was started far from the training data, and then optimized
(green).
The animation on the left correspond to the red curve, while the animation on the right correspond to the green curve. Both animations start from the mean pose (corresponding to points far enough away from the data) and gradually enter walk cycles. The optimized animation enters the walk cycle more quickly.
An example from a walking model learned using 2nd order dynamics with RBF kernel, here the mean prediction generates a walk cycle away from the training data (red curve). On the other hand, the optimized prediction (green curve) stays close to the data.
We see that due to drifting far away from the data, the left animation (corresponding to red curve) shows an unnatural looking skipping motion, while the animation on the right (corresponding to green curve) shows a smooth walk cycle.