To perform the analysis of your experimental data for assignment 2, you'll probably want to do some sort of ANOVA (analysis of variance). You are free to perform your analysis with any software package you choose, however for your convenience SAS has been made accessible to you.
SAS is available on werewolf.cdf.toronto.edu (and possibly other cdf machines) and can be invoked by typing "sas". When you run SAS, you should see many windows open up. The most important ones are the Program Editor (where you can enter or load scripts), the Log, and the Output windows.
SAS is script based. The user can enter or load a script that contains commands for retrieving, processing, and analyzing data. As a script is run, the output generated by SAS is appended to a document in the Output window. After the entire script has run, the user can scroll through the output in the Output window, and optionally run another script.
I recommend the following workflow when using SAS. Rather than write your SAS script directly in the Program Editor window, it's probably safer to edit your SAS script in a stand-alone plain text editor (like vi, emacs, or pico). Every time you want to run your script, first save it out from your plain text editor to a file whose name has a .sas extension. Then, clear the Output and Log windows by selecting Edit->Clear All in both windows. Next, select File->Open in the Program Editor window to load your script. Finally, select Run->Submit in the Program Editor window to run your program. (Unfortunately, your script will probably disappear from the Program Editor window when it is submitted, which is why I recommend editing it from a stand-alone text editor.) After running the script, check the Log window for errors, and scroll through the Output window for the output generated by each command in your script. Note that a single command in a SAS script can sometimes generate several pages of output in the Output window.
During your experiment, your program should have generated one output file for each user. These output files are precious; they represent hours of time and effort it getting users to sit down and try your system. So make sure you have multiple backups of these files, in their original form, before doing anything with them.
To make the analysis of your data easier with SAS, as a first step you could concatenate all your data files together into one. You can do this in UNIX with the "cat" command:
cat output_* > output_all
Then, in your SAS script, you can simply read in output_all. SAS is able to read in plain text files, and interprets the lines in the file as entries in a table of data (much like in a spreadsheet). In SAS terminology, each line in your data file is an observation.
Here's a first script to try out with SAS. Take a look at it. It's commented. Try running it. Look at the pages of output it produces in the Output window. Try running it again. Notice how output gets appended in the Output window. Now try clearing the Output window with Edit->Clear All, and then running it. Isn't that nicer ?
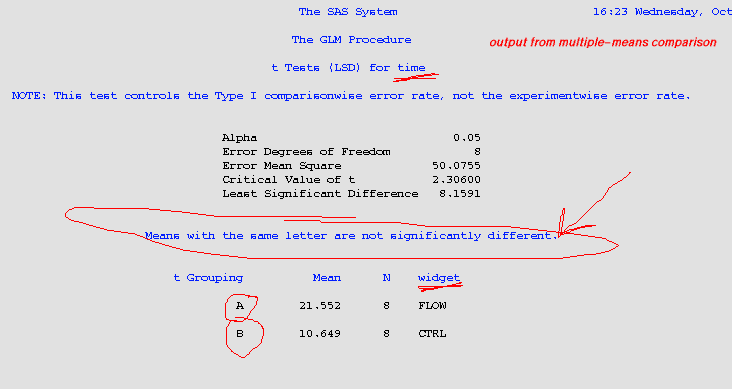
Here's a sample script that performs an ANOVA (analysis of variance) and a multiple-means comparison. The ANOVA determines if an independent variable has a significant effect on a dependent variable (if you see a p value of 0.05 or less, there's a significant effect; furthermore, the size of the F value provides a measure of the strength of the effect). The multiple-means comparison, in contrast, determines how exactly the dependent variable varies with an independent variable.
Here's a portion of the sample script's output corresponding to the results of the ANOVA. As can by seen, the "condition" variable has a significant effect on the "time" variable (see comments in sample script for more explanation). Note from Shen: when you report your data for your experiment, you should report the data under "Type III SS" (bottom portion) instead of "Type I SS" (top portion).

Here's another portion of the sample script's output, corresponding to the multiple-means comparison (in this particular example, the output here isn't very interesting):

Basically, to determine if variable x has an effect on variable y, do an ANOVA to see if you get a significant p value, and then if you do, look at the multiple means comparison to see for what values of x you have y taking on significantly different values.
Here's a sample script that performs linear regression. I expect most students will not have any need or desire to perform regression. A regression could be interesting, however, if you wanted (for example) to see if your data fits a straight line (as one would expect in, for example, a task modelled by Fitts' Law). If you expect a task to be well modelled by Fitts' Law, and you perform an appropirate regression of the data you collected and find that the regression yields an r value close to 1.0, then you have evidence that your model was a good one.
Here's what the output from a linear regression (the "reg" command) looks like:
